Input Options
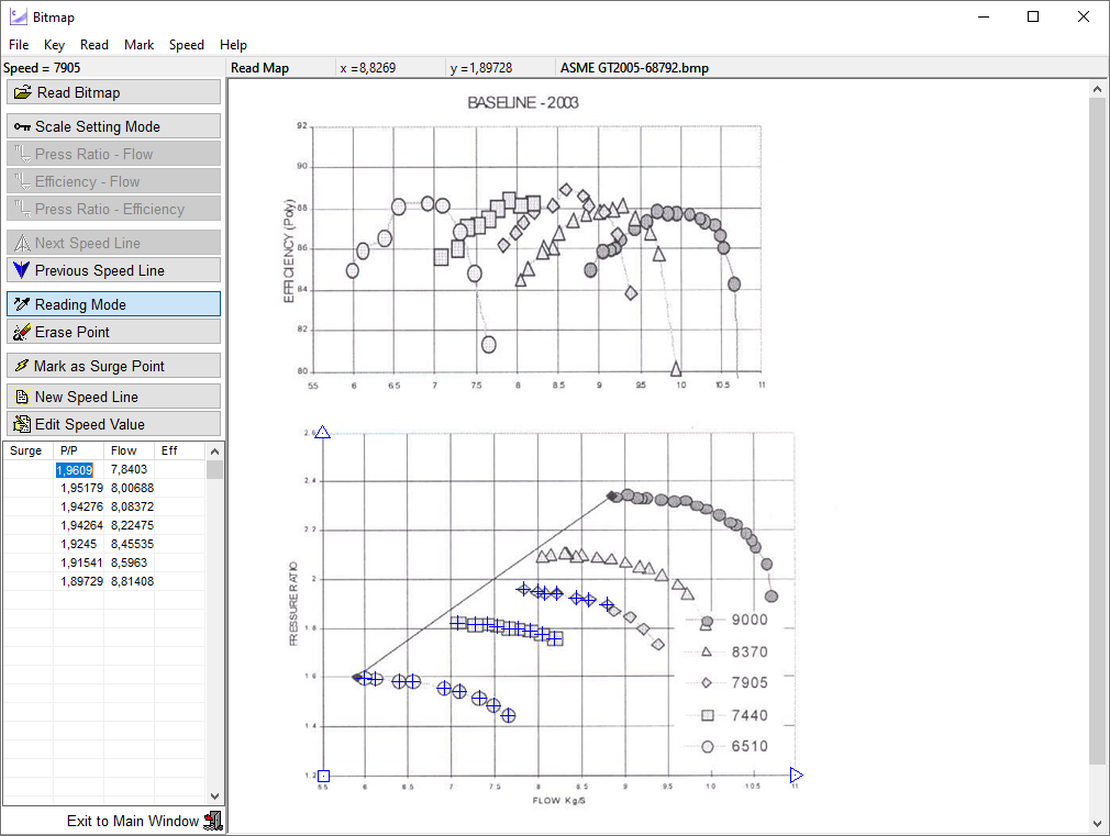
Measured data or calculated values can be read from a file or entered manually. Another option is to read data from a scanned image: move the mouse pointer to a point on a speed line and click. The coordinates of this point will show up in the table on the left of the accompanying figure. Add successive points to the table by clicking on the various points on the speed line. The sequence of the points on a speed line is of no importance.
Physical Quantities
Pressure Ratio
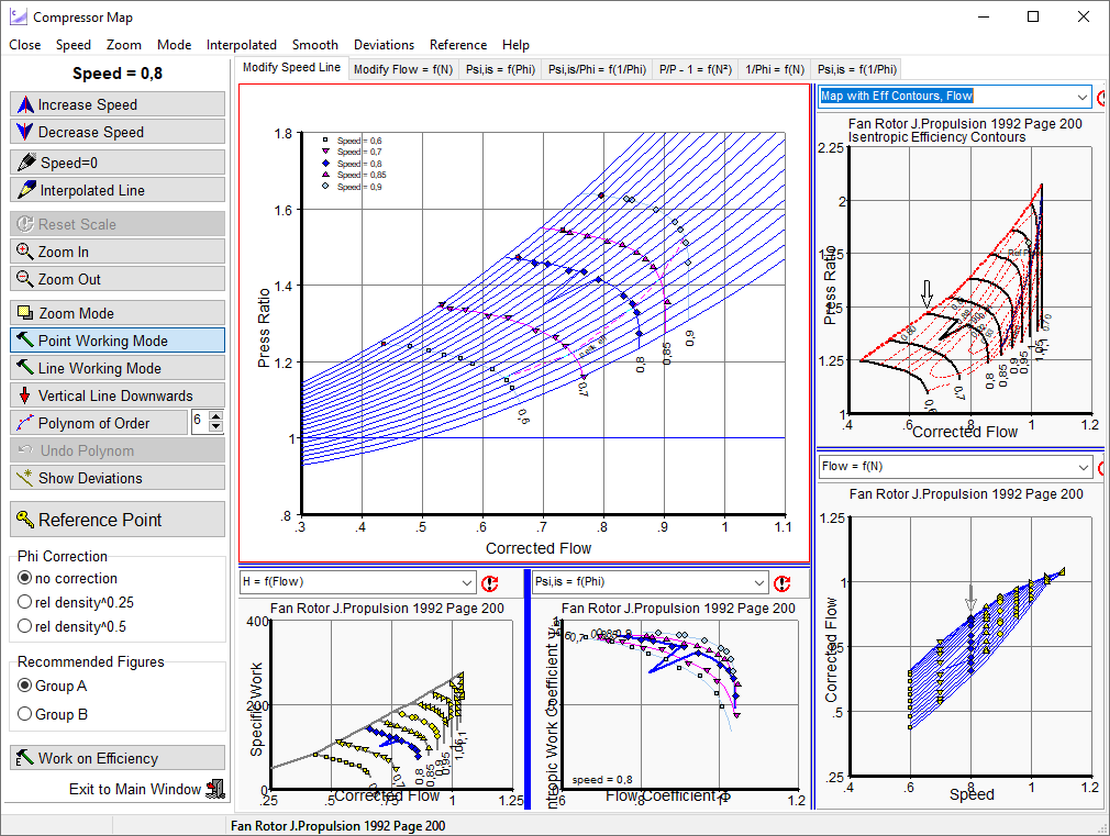
The program will automatically draw more or less smooth lines passing through the measured data. These drafted speed lines (i.e. the pressure ratio - corrected flow lines) can be adapted with the help of the mouse. Move the pointer to the position where you want to correct the speed line, press the left button and hold it down while moving the mouse. This modifies two segments of the line; use the mouse to move the lines to the correct place and release the button to fix the smooth line in its new position.
Corrected Mass Flow
As far as a turbines are concerned, instead of modifying the pressure ratio, the corrected mass flow can be adapted analogously.
Efficiency
Adjusting the efficiency lines is similar to adjusting the pressure ratio or corrected mass flow values. The effect of any modification in the top left picture is shown immediately in three other figures. In this way it’s possible to see whether the smooth lines adhere to the laws of physics.
Beta Lines
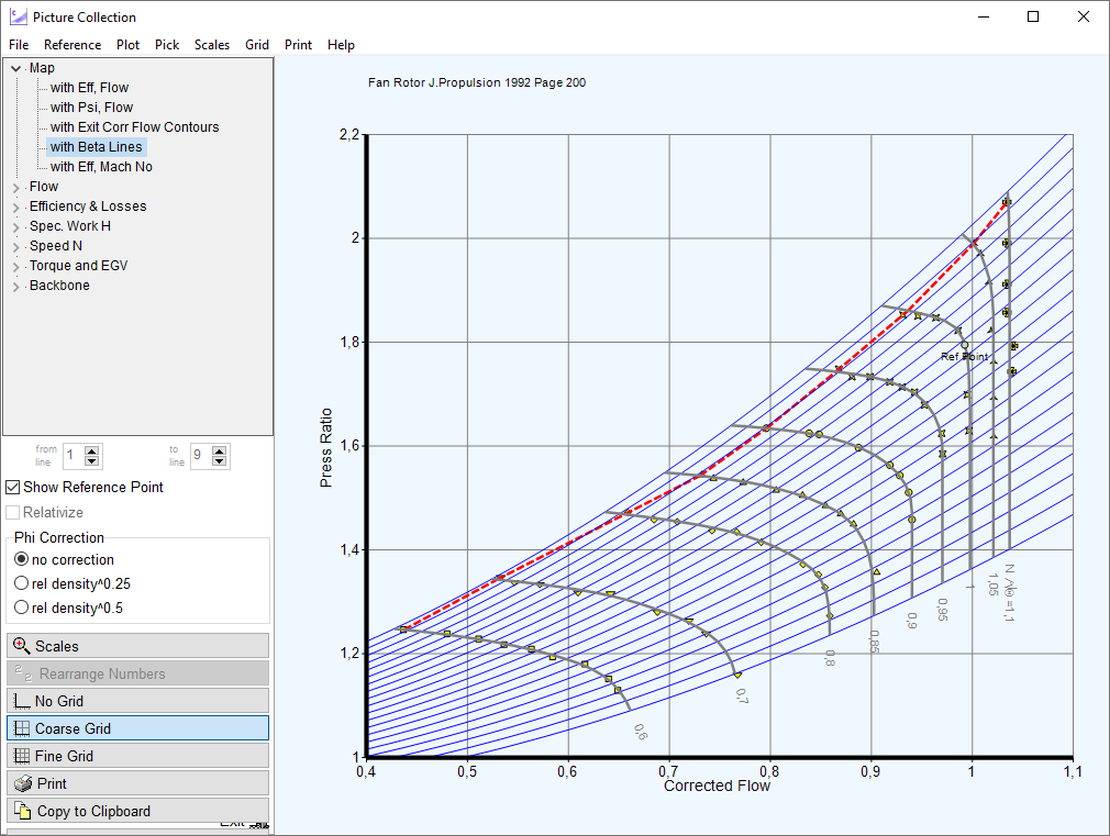
Beta lines are required in order to read a map unambiguously. In general, they have no meaning in terms of physics, however, the beta lines can be defined in such a way that they represent the work coefficient fairly accurately.
Visual Consistency Check
Smooth C offers many pre-configured plots for checking the consistency of a compressor map, thus enabling easier and more consistent interpolation of speed lines in relation to the rest of the map. Here is an example of the many pictures offered for checking. The same applies to Smooth T.
Map Collection
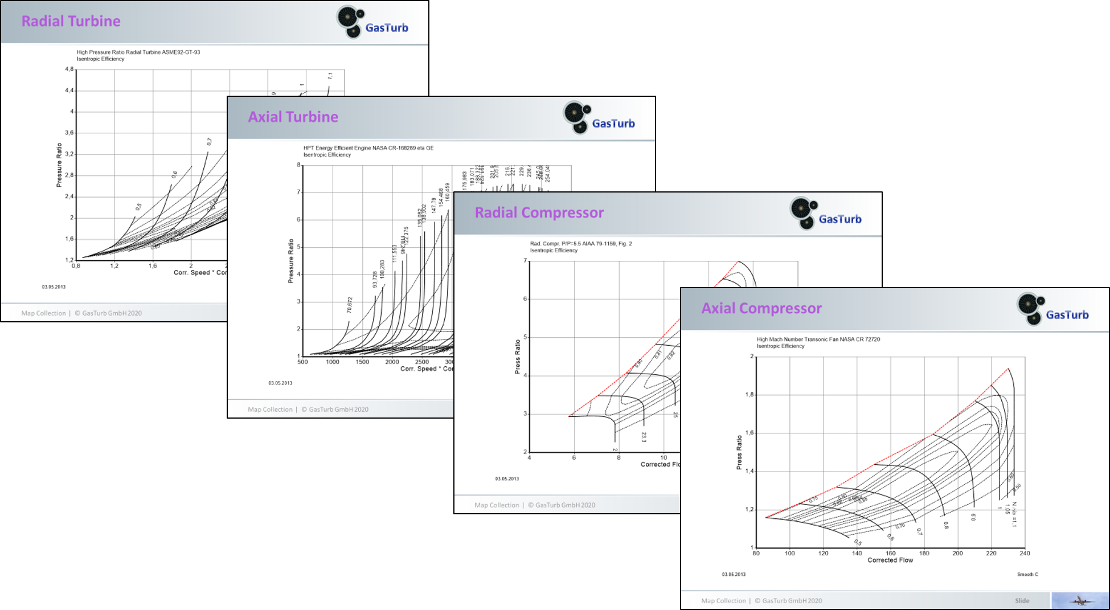
The accuracy of performance simulations depends on component maps adequately describing compressor and turbine operation. Comprising 58 compressor maps and 18 turbine maps, the Map Collection 3 provides a starting point for the modeling of a diversity of gas turbines. All maps are ready to use with GasTurb and can be modified with Smooth C and Smooth T. The component maps are included in the GasTurb Laboratory package and can also be purchased separately. Please contact us for further information.
Manual
Both Smooth C and Smooth T are provided with a freely accessible and comprehensive manual which describes in detail the functions of the programs. The manuals can be downloaded here.


Demo versions of Smooth C and Smooth T for Windows 7, 8, 10 and 11 can be downloaded under the link below. If you need support or would like to purchase Smooth C or Smooth T, which are available in different packages, please feel free to contact us.